Introduction
The CAI( Comprehensive air-quality index ) is a way of describing ambient air quality based on health risk of air pollution. The index aims to help the public easily understand air quality level and protect the health of people from air pollution.
How to Calculate the CAI Value
Calculate the value of the CAI by pollutants
Calculate CAI values for each of six air pollutants and use the highest value as an CAI value.
If more than two pollutants are included in the categories of C,D,E additional values are added to the CAI value;
- If one pollutant is included in one of those categories, its value becomes the CAI
- If two pollutants are included, the pollutant with the highest value is described as an responsible pollutant, and 50 values are added to the value of the responsible pollutant.
- If three pollutants are included, the pollutant with the highest value is described as an responsible pollutant, and 75 values are added to the value of the responsible pollutant.
- The CAI has values of 0 through 500, which are divided into four categories. The higher the CAI value, the greater the level of air pollution.
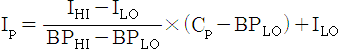
- Ip = The air quality index for each target pollutant
- Cp = The rounded concentration of each target pollutant
- BPHI = The breakpoint that is greater than or equal to Cp
- BPLO = The breakpoint that is less than or equal to Cp
- IHI = The index value corresponding to BPHI
- ILO = The index value corresponding to BPLO
- Variables required in calculating the CAI
Variables required in calculating the CAI
| Description |
Good |
Moderate |
Unhealthy |
Very unhealthy |
| Values |
ILO |
0 |
51 |
101 |
251 |
| IHI |
50 |
100 |
250 |
500 |
| Concentration |
BPLO |
BPHI |
BPLO |
BPHI |
BPLO |
BPHI |
BPLO |
BPHI |
| SO2(ppm) |
1hr |
0 |
0.02 |
0.021 |
0.05 |
0.051 |
0.15 |
0.151 |
1 |
| CO(ppm) |
1hr |
0 |
2 |
2.1 |
9 |
9.1 |
15 |
15.1 |
50 |
| O3(ppm) |
1hr |
0 |
0.03 |
0.031 |
0.09 |
0.091 |
0.15 |
0.151 |
0.6 |
| NO2(ppm) |
1hr |
0 |
0.03 |
0.031 |
0.06 |
0.061 |
0.2 |
0.201 |
2 |
| PM10(㎍/㎥) |
24hr |
0 |
30 |
31 |
80 |
81 |
150 |
151 |
600 |
| PM2.5(㎍/㎥) |
24hr |
0 |
15 |
16 |
35 |
36 |
75 |
76 |
500 |
PM10, PM2.5 24hr(C24E): 24hr prediction moving average of PM10, PM2.5
- C24E = [C12 × 12 + C4 × 12] ÷ 24 where,
- C12 = Average of the past 12 hours
- C4 = Average of the past 4 hours
= ( Cai + Ca(i-1) + Ca(i-2) + Ca(i-3)) ÷ 4
- Ci = standard time measurement concentration (I = standard time)
- Ci < M ⇒ Cai = Ci
- Ci ≥ M, Ci / C12 < 0.9 or Ci / C12 > 1.7 ⇒ Cai = Ci
- Ci ≥ M, 0.9 ≤ Ci / C12 ≤ 1.7 ⇒ Cai = 0.75 ×Ci
※ M : 70㎍/㎥ for PM10 and 30㎍/㎥ for PM2.5
Color Representation of the CAI
Color Representation of the CAI
| |
GOOD |
Moderate |
Unhealthy |
Very Unhealthy |
| Colors |
Blue |
Green |
Yellow |
Red |
| RGB Code |
0000FF |
00FF00 |
FFFF00 |
FF0000 |
| Pictogram |
 |
 |
 |
 |
Understanding the CAI
Understanding the CAI
| Description |
Good |
Moderate |
Unhealthy |
Very unhealthy |
| values |
0~50 |
51~100 |
101~250 |
251~350 |
351~500 |
| Health Effects |
A level that will not impact patients suffering from diseases related to air pollution |
A level which may have a meager impact on patients in case of chronic exposure |
A level that may have harmful impacts on patients and members of sensitive groups (children, aged or weak people), and also cause the general public unpleasant feelings |
A level which may have a serious impact on patients and members of sensitive groups in case of acute exposure, and that even the general public can be weakly affected |
A level which may need to take emergency measures for patients and members of sensitive groups and have harmful impacts on the general public |